 |
How
Close Do You Have To Be
|
| |
How
Close Do You Have To Be
|
How Close Do You Have To Be To Learn The Lesson?
Fire Burns!
Australia experiences a range of disasters, but during the prolonged drought, one of the most common and devastating natural disasters has been that of bushfires; even when floods were covering some parts of Australia, fire was destroying other areas. Does awareness of one’s level of risk make a difference to our preparedness to combat future fire risks? Or is it that we have to personally encounter a fire on our own doorstep before we take action to ensure that the next time it happens we know that we have done all we could to avert the fire danger? A larger study on rural residents’ responses (N = 713) to a survey on preparedness for, and experience of, bushfires was conducted a year after one of the worst bushfire seasons in Australia and after ongoing devastating grass, forest and fire storms in South East Queensland. A report on the descriptive data from that survey has been published elsewhere. The analyses presented here focus on risk, exposure, and experience factors relating to bushfire preparedness in rural areas with a bushfire history.
How Close Do You Have To Be To Learn The Lesson?
Fire Burns!
Australia has always been an arid land and experiences periods of hot, dry weather and with certain types of vegetation, some areas are more bushfire prone than others. See Clack (2003), Collins (2006) and the Commonwealth of Australia (2003) for descriptions and stories about the historical and recent fires in Australia.
The Bureau of Meteorology (BOM) reports that, along with southern California and southern France, Australia is one of the three top fire prone areas in the world. Bushfires consistently burned throughout Australia over the past few years because of the severe drought conditions. Some fires are labelled for historical and descriptive purposes. For instance, the label Black Friday has been generally reserved for the worst bushfire in Australia which occurred on 13th January, 1939 when the temperature reached 45.6 degrees; this high temperature, along with extremely dry conditions and low humidity and strong driving winds provided the necessary conditions for the bushfire disaster to follow. Around two million hectares and 71 houses were burned and thousands of farm animals destroyed. However, other horrific episodes have been repeated in Victoria in 1983 (Ash Wednesday), in Canberra in 2003 and in South East Queensland in the summer of 2004. Looking back, as the decade has unfolded so too have the bushfires: Blue Mountains 2001; Canberra 2003; South East Queensland 2002 - 2005; Victoria, New South Wales, South Australia, Tasmania 2006/2007 and Western Australia December 2007/January 2008.
This article focuses on South East Queensland (SEQ) where the authors have resided for many years. The bushfire season in SEQ is generally experienced in spring and summer (BOM, 13.09.07; http://www.bom.gov.au/inside/services_policy/fire_ag/bushfire/threat.htm).
BUSHFIRE REALITY
South East Queensland: October 2004The 2nd was a hot, dry and windy day about south eastern Queensland with more than a dozen bush and grass fires reported. A caravan and some machinery were lost in a fire at Miriam Vale just before 3 pm. Police were forced to close the Brisbane Valley Highway just after 3 pm as a grass fire about 10 kilometres south of Esk caused a smoke hazard.
On the 6th a bushfire started on Mt Coot-tha in the western suburbs of Brisbane about 9 am and quickly bought the studios of Channel 10 and some nearby homes under threat. About 200 hectares or most of the western side of the mountain was destroyed in the fire. At Nanango, a major fire began around 3 pm and burned for the next couple of weeks until rain eventually put it out.
On the 7th a fire at Wongawallan in the Gold Coast Hinterland burned out 2,500 hectares of bushland. An eco lodge was threatened and evacuation was considered.
At Kilcoy, five separate major fires were burning around the area, one of which started two weeks earlier in inaccessible terrain. Considerable property protection (backburning) was required. Over 40,000 hectares would be destroyed over the next couple of weeks before rainfall finally extinguished the fires.
A large grass fire at Acacia Ridge in Brisbane forced the closure of one road and the railway line heading south to New South Wales. A grassfire at Postmans Ridge to the west of Brisbane forced the closure of the Warrego Highway and threatened homes. It was bought under control later in the day.
The 8th was a day of extreme fire dangers as record and near record October temperatures, high winds (gusting to over 60 km/h) and very low humidity combined to make fires largely uncontrollable. Much property was lost, though fortunately no lives were lost.
The ongoing fire at Wongawallan jumped containment lines and headed south east towards homes. The eco lodge under threat was evacuated. At Kilcoy, one of the fires also started heading for homes. Another destroyed a banana plantation. A fifth fire broke out in the area during the afternoon, initially burning in inaccessible country.
Further new outbreaks occurred at Bunburra (near Boonah) and Toorbul (on the way to Bribie Island), burning several old car bodies and threatening homes.
Five fires occurred in the Helidon area. One fire destroyed a home, a second destroyed a shed and outbuildings and was burning close to a house, while the other three threatened homes.
A large grassfire at Mudgeeraba destroyed one shed and a vehicle. Homes were reported alight in Gaven (Gold Coast Hinterland) and back burning was required to protect further property.
A fire at Caboolture damaged a shed and threatened homes. Reported behaviour of the fire included spotting to a distance of 3 kilometres ahead of the fire and flame heights 13 metres and more. Crowning in many areas.
An emergency situation was declared in Crows Nest at approximately 3:30 pm as 3 homes and 3 sheds were destroyed.
On the 14th there was a wildfire near Moogerah (Boonah Shire) and a shed was destroyed by a fire at Crows Nest.
On the 15th a large grassfire threatened homes near Ocean View Road, Ocean View. Homes in the Stapylton area were threatened by another fire. Yet another fire burned 6,000 hectares near Mount Larcom (SW of Calliope).
On the 23rd - 24th further fire outbreaks occurred across southeast Queensland. At Esk, 25 houses were evacuated along Highland Street after a grass fire swept through the area. A machinery shed was destroyed and one person treated for smoke inhalation. Other fires occurred at Browns Plains, Sandy Creek/Kilcoy (1,000 hectares), Beachmere, Jimboomba, Gin Gin, Nanango, and Blackbutt.
Report from Bureau of Meteorology site: Significant Weather - October 2004 http://www.bom.gov.au/inside/services_policy/public/sigwxsum/sigw1004.shtml
It was the nature of the October 2004 Black Friday in South East Queensland that was the impetus for this study, with widespread forest, grass fires and fire storms being endured by rural and town residents. According to the Bureau of Meterology (BOM, 13.09.07), there is a difference between grass and forest fires, with forest fires travelling at 1 to 3 km/hr, although severe fires can go as fast as 12km/hr; while grass fires generally move at 3 to 10 km, but record speeds of 25km/hr have been recorded.
Terrified residents were not concerned about the type of fire, only that they would be fortunate enough to escape the fate of thousands of others across Australia who had lost property, animals, and in some cases family members, to the wrath of Hephaestus the fire god.
It seems that being terrified might just be the only real teacher in terms of future fire preparedness, because while lighting might not strike twice in non alluvial soils, bushfires certainly do. Indeed research over several decades on a number of different natural disasters has shown that the willingness to heed hazard warnings increases with previous experience and actual closeness to the hazard (Gow, 2007). But just how close does one have to be to the fire to take action and to be prepared for future emergencies? This article takes a look at this question.
Preparedness
Most countries now have prevention and preparedness programs in operation, although
Rohrmann (1999) has queried whether all the effort in education program and
media communications about risk and bushfires has been actually successful?
In Australia, most States and many local councils have web and print publications
that deal with disaster preparedness and management. For example, Wingecarribee
Bush Fire Management Committee has put forth a Bush fire risk management plan
(2001) and so too has the Blue Mountains Bushfire Management Committee (1997).
Mornington Peninsula Shire (2006) has prepared a comprehensive document on Fire
Wise fire management. The shire councils around the area of study also refer
to Bushfire management strategies (see Crows Nest, Esk, Gatton, Kilcoy and Laidley
council website references).
Education. Another example of preparation education is that of the government of South Australia which has produced a guide for residents and landholders entitled: Bushfire prevention and preparedness (2006). (See the South Australian Metropolitan Fire Service web page http://www.samfs.sa.gov.au ). This covers burning off, bushfire behaviour, care of pets and livestock, fuel breaks, how houses burn, identifying hazards around one's home, personal survival, protection of fodder reserves and sprinkler systems. State Government websites promulgate information that advises residents how to prevent or reduce the likelihood of fire, and what action to take in case a bushfire occurs on or near their property.
These education programs generally cover several aspects of Rhodes and Reinholtd (1999) five key dimensions of wildfire preparedness:
1. Awareness and recognition of the wildfire risk
2. Knowledge of fire behaviour and fire safety measures
3. Planning for the event of the fire
4. Physical preparations of property and household; and
5. Psychological readiness involving confidence and self-reliance.
While these programs attempt to raise awareness of risk, and even use multi media advertisements to increase psychological readiness, it is very difficult to increase the confidence and self reliance of residents and indeed to check that they have the wherewithal to physically prepare for a fire, or to reduce its impact. Also there are few people who can tell you that the four basic ingredients of a fire are: fuel, oxygen, heat and a chemical reaction between the first three factors.
However, fire preparedness education continues and in Queensland, the Rural Fire Service (www.ruralfire.qld.gov.au) working with the Queensland Fire and Rescue Service (www.fire.qld.gov.au) warn residents in semi-rural areas that bushfires are not just a threat to rural communities. The same messages about preparedness appear time and time again.
Moreover, these are not new prevention education strategies; they have been promulgated throughout Australia (and within South East Queensland) for several years through the medium of TV, radio, newspaper advertisements and inserts into local newspapers and letterbox drops.
Similar warnings were made before, during, and after the severe summer fires of 2004/2005, and thus it is interesting to note whether a year after these serious fire episodes, residents who were living in areas which had witnessed or suffered devastation from those bushfires (grass fires, forest fires, firestorms etc.), were sufficiently motivated to ensure that during those summer months they would be as best prepared as they could be.
Arguments exist for and against the notion that previous exposure to fires raises awareness and increases the likelihood that the person will be more vigilant in the future (see the Bibliography by Bandy, Johnson, Peek & Sutton, 2004 of the following researchers: Anderson, 1968; Farley, 1993; Flynn & Chalmers, 1980; Foster, 1980; Hodler, 1982; Moore, Bates, Layman & Parenton, 1963; Perry & Greene, 1983; Perry, 1979; Sorensen, 1982; Williams, 1957; Windham, Posey, Ross, & Spencer, 1977). However, very little research has been conducted with residents who live in previously burned areas (and who have witnessed those disasters) to ascertain whether there is a difference in terms of their future preparedness based on their proximity to earlier bushfires.
This article reports on one of those rare occasions when researchers had the opportunity to survey residents who had actually been burned, or who had to face firestorms, grass fires and forest fires racing towards their properties in one of the hottest summers on record; the results of the actual survey questions are in the process of being published in another journal, but preliminary results of 142 responses can be found on http://www.humanities.qut.edu.au/research/socialchange/2006proceedings.jsp
This opportunity arose following data collection on bushfire preparedness in the Crows Nest, Esk, Kilcoy, and Laidley shires of South East Queensland. Three posthoc questions were posed of the data: (1) Does it make any difference to future preparedness, if you were exposed to severe fires 4 kilometers away versus 1- 4 kilometers? (2) In terms of actual experience of fire, with respect to future preparedness, can we distinguish between those residents who saw the fire lapping at the edge of their property, and those who had to evacuate their properties and those who were personally burned, lost animals, houses or stock? (3) Did any of the existing risk factors make an impact on resident’s preparedness levels?
The survey was conducted about 12 months after Black Friday of October 2004, in the shires of Esk, Crows Nest, Kilcoy and Laidley (see Figure 1 for a map of those areas).
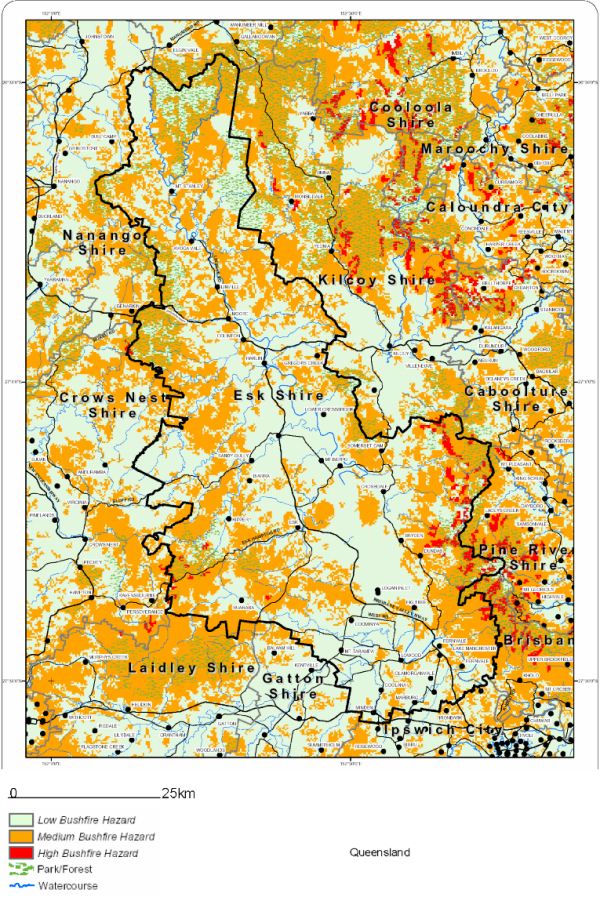
Figure 1. Map containing shires (Crows Nest, Esk, Gatton
& Laidley)
which had suffered severed bushfires previously.
Adapted from: Rural Fire Service, 2002. (Queensland)
The 32 item questionnaire was constructed to tap the constructs of preparedness as the main outcome variable under study and to check whether constructs such as previous experience of being in a bushfire area and witnessing fires, actual personal exposure to bushfires, and/or having additional risk factors (as outlined below), would make a difference to a person’s future preparedness.
The questionnaire (together with reply paid return envelope) was mailed out to approximately 4950 rural households outside towns on rural properties between late November 2005 and early January 2006, the longer time span being caused by lack of access to bulk mail outs in these country areas during the busy Christmas mail period. A total of seven hundred and thirteen completed questionnaires were returned (a 14.4% return rate; we have no way of knowing how many surveys actually reached their destination, as we found two large bundles sitting in country post offices non-delivered). However, several residents felt strongly enough about their bushfire experiences that they wrote copious notes about their experiences, sent in photos of burning paddocks or phoned the researchers to talk about their experiences and what they believed had to be done by the authorities to manage bushfires in the future. A copy of the questionnaire can be obtained from the lead author.
In this survey, risk factors were measured by questionnaire items 9, 13, 14, 15, 16, and 27. Exposure to bushfires was captured by items 28-31. Item 31 had asked if they had encountered a bushfire in or near their home, while actual personal experience was taken from item 31b which asked how close the fire was to them. It was the vivisection of the responses to item 31b that brought out the critical nature of the differences in preparedness in this study. Preparedness for future bushfires was distilled from responses to questions 12, 12b, 17, 18, 19, 20 21, 22, 23, 23a, 24a/b, 25, 26 a/b and 32.
Other items (1- 6, 7a, 9a, 10) focused on home ownership, size and usage of property, vegetation, age, education, occupation and family and pets/animals and length of residency in area. [Items 8 and 11 were included as a measure of living arrangements and occupation.]
A reporting of information on the range of information contained within the questionnaire on preparedness can be found in Pritchard, Gow, Childs & Chant (in preparation). It is the intention of this article to highlight an issue not published before about the distinctions in actual distance from the fire in terms of the future preparedness of people who had experienced bushfires previously. The analyses presented here focus on Risk, Exposure, and Personal Experience factors relating to Preparedness.
In order to confirm that our conjectured factors of experience, exposure and risk were contained within the obtained data, a principal components analysis was undertaken. Thus three indices were derived from the responses (N = 713) to specific questionnaire items in order to capture the constructs of exposure to bushfires, preparedness, and risk factors. The indices are the principal components of nominated questionnaire items and, for ease of interpretation, are standardised to a mean of 100 and a standard deviation of 15 across all respondents for whom a given index is derivable. Table 1 indicates the indices construction, which was carried out in two iterations. First, a given index was derived from a set of questionnaire items (as indicated in Tables 1A and 1B) and the loading, that is, the correlation between each item and the index, inspected. If the absolute value of the correlation was at least .30, then that item was entered into a second iteration which gave the final value of the index, for which all loadings in fact exceeded .35. Table 1 shows details of both iterations, and Table 2 final sample sizes, and the inter-iteration correlations, which indicate good stability of the index calculations.
Table 1 a. First iteration: Loadings ( r ), their
degrees of freedom ( df ) & their significance ( p ),
between indices and their component questionnaire items.
| Index | Index name | Questionnaire item | r
|
df
|
p
|
|---|---|---|---|---|---|
| 1
|
Exposure | Q28_1 | 0.88 | 708 | 0.000 |
| 1
|
Exposure | Q28_2 | 0.90 | 708 | 0.000 |
| 1
|
Exposure | Q29a | 0.35 | 708 | 0.000 |
| 1
|
Exposure | Q30a | 0.36 | 708 | 0.000 |
| 1
|
Exposure | Q31 | 0.51 | 708 | 0.000 |
| 2
|
Preparedness | Q12FB | 0.40 | 673 | 0.000 |
| 2
|
Preparedness | Q12A | 0.36 | 673 | 0.000 |
| 2
|
Preparedness | Q12SES | 0.44 | 673 | 0.000 |
| 2
|
Preparedness | Q12E | 0.46 | 673 | 0.000 |
| 2
|
Preparedness | Q12b | 0.46 | 673 | 0.000 |
| 2
|
Preparedness | Q13a | 0.15 | 673 | 0.000 |
| 2
|
Preparedness | Q13b | 0.10 | 673 | 0.007 |
| 2
|
Preparedness | Q14 | 0.07 | 673 | 0.064 |
| 2
|
Preparedness | Q15 | 0.16 | 673 | 0.000 |
| 2
|
Preparedness | Q16 | 0.08 | 673 | 0.030 |
| 2
|
Preparedness | Q17 | 0.40 | 673 | 0.000 |
| 2
|
Preparedness | Q19 | 0.38 | 673 | 0.000 |
| 2
|
Preparedness | Q20R | 0.11 | 673 | 0.005 |
| 2
|
Preparedness | Q20TV | -0.06 | 673 | 0.093 |
| 2
|
Preparedness | Q20I | 0.11 | 673 | 0.005 |
| 2
|
Preparedness | Q20P | 0.38 | 673 | 0.000 |
| 2
|
Preparedness | Q20N | 0.28 | 673 | 0.000 |
| 2
|
Preparedness | Q21 | -0.01 | 673 | 0.978 |
| 2
|
Preparedness | Q22G | -0.19 | 673 | 0.000 |
| 2
|
Preparedness | Q22S | 0.29 | 673 | 0.000 |
| 2
|
Preparedness | Q22V | -0.07 | 673 | 0.072 |
| 2
|
Preparedness | Q22IH | -0.05 | 673 | 0.151 |
| 2
|
Preparedness | Q22UH | -0.07 | 673 | 0.079 |
| 2
|
Preparedness | Q23a | -0.20 | 673 | 0.000 |
| 2
|
Preparedness | Q24a | 0.31 | 673 | 0.000 |
| 2
|
Preparedness | Q24bG | 0.19 | 673 | 0.005 |
| 2
|
Preparedness | Q24bS | 0.42 | 673 | 0.000 |
| 2
|
Preparedness | Q24bV | 0.07 | 673 | 0.061 |
| 2
|
Preparedness | Q24bIH | -0.06 | 673 | 0.134 |
| 2
|
Preparedness | Q24bUH | 0.07 | 673 | 0.084 |
| 2
|
Preparedness | Q25T | 0.24 | 673 | 0.000 |
| 2
|
Preparedness | Q25TW | -0.25 | 673 | 0.000 |
| 2
|
Preparedness | Q25B | 0.27 | 673 | 0.000 |
| 2
|
Preparedness | Q25D | 0.28 | 673 | 0.000 |
| 2
|
Preparedness | Q26aS | 0.35 | 673 | 0.000 |
| 2
|
Preparedness | Q26aHB | 0.37 | 673 | 0.000 |
| 2
|
Preparedness | Q26aA | 0.48 | 673 | 0.000 |
| 2
|
Preparedness | Q26aPP | 0.49 | 673 | 0.000 |
| 2
|
Preparedness | Q26aFB | 0.24 | 673 | 0.000 |
| 2
|
Preparedness | Q26aFH | 0.29 | 673 | 0.000 |
| 2
|
Preparedness | Q26aWP | 0.46 | 673 | 0.000 |
| 2
|
Preparedness | Q26bG | 0.07 | 673 | 0.068 |
| 2
|
Preparedness | Q26bS | 0.41 | 673 | 0.000 |
| 2
|
Preparedness | Q26bV | 0.16 | 673 | 0.000 |
| 2
|
Preparedness | Q26bIH | 0.04 | 673 | 0.284 |
| 2
|
Preparedness | Q26bUH | 0.02 | 673 | 0.548 |
| 2
|
Preparedness | Q32 | 0.34 | 673 | 0.000 |
| 3
|
Risk Factors | Q9aElderly | 0.03 | 653 | 0.399 |
| 3
|
Risk Factors | Q9aInfirm | 0.05 | 653 | 0.185 |
| 3
|
Risk Factors | Q9aSNeeds | 0.09 | 653 | 0.020 |
| 3
|
Risk Factors | Q9aYChildren | 0.03 | 653 | 0.478 |
| 3
|
Risk Factors | Q9bPets | 0.03 | 653 | 0.413 |
| 3
|
Risk Factors | Q9bHorses | 0.09 | 653 | 0.016 |
| 3
|
Risk Factors | Q9bFarmAnimals | 0.02 | 653 | 0.524 |
| 3
|
Risk Factors | Q9bCagedAnimals | 0.05 | 653 | 0.184 |
| 3
|
Risk Factors | Q13a | 0.02 | 653 | 0.547 |
| 3
|
Risk Factors | Q13b | 0.04 | 653 | 0.266 |
| 3
|
Risk Factors | Q14 | 0.09 | 653 | 0.023 |
| 3
|
Risk Factors | Q15 | 0.03 | 653 | 0.437 |
| 3
|
Risk Factors | Q16 | -0.08 | 653 | 0.046 |
| 3
|
Risk Factors | Q27_1 | 0.61 | 653 | 0.000 |
| 3
|
Risk Factors | Q27_2 | 0.70 | 653 | 0.000 |
| 3
|
Risk Factors | Q27_3 | 0.82 | 653 | 0.000 |
| 3
|
Risk Factors | Q27_4 | 0.76 | 653 | 0.000 |
| 3
|
Risk Factors | Q27_5 | 0.74 | 653 | 0.000 |
In the first iteration, the five items loading onto the first principal component (PC) (exposure to bushfires) relate to their perceived likelihood of being caught in a fire in the short and intermediate term, their viewing of bushfires on TV, their own eyewitness accounts and their own close encounters with fires on or near their properties.
The second PC (preparedness) items relate to: knowing what emergency phone numbers to ring (and where these numbers were stored) such as the fire brigade, ambulance, police, emergency services and electricity company; having a motor vehicle, telephone, mobile phone, internet access, smoke detector; safely storing flammable products; being able to access bushfire information updates, knowing how to access disaster information; having an evaluation plan; keeping properties fireproof by keeping gutters clean and having fire fighting equipment and water supplies to hand.
The third PC (Risk factors) Included information about dependents such as children, aged, infirm, pets, farm animals, and a five item scale measuring factors that prevented the residents from carrying out fire preparedness actions (see below).
Table 1b. Second iteration: Loadings ( r ), their
degrees of freedom ( df ) & their significance ( p ),
between indices and their component questionnaire items.
| Index | Index Name | Item | r
|
df
|
p
|
|---|---|---|---|---|---|
| 1
|
Exposure | Q28_1 | 0.88 | 708 | 0.000 |
| 1
|
Exposure | Q28_2 | 0.90 | 708 | 0.000 |
| 1
|
Exposure | Q29a | 0.35 | 708 | 0.000 |
| 1
|
Exposure | Q30a | 0.36 | 708 | 0.000 |
| 1
|
Exposure | Q31 | 0.51 | 708 | 0.000 |
| 2
|
Preparedness | Q12FB | 0.57 | 711 | 0.000 |
| 2
|
Preparedness | Q12A | 0.54 | 711 | 0.000 |
| 2
|
Preparedness | Q12SES | 0.53 | 711 | 0.000 |
| 2
|
Preparedness | Q12E | 0.56 | 711 | 0.000 |
| 2
|
Preparedness | Q12b | 0.54 | 711 | 0.000 |
| 2
|
Preparedness | Q17 | 0.47 | 711 | 0.000 |
| 2
|
Preparedness | Q19 | 0.43 | 711 | 0.000 |
| 2
|
Preparedness | Q20P | 0.37 | 711 | 0.000 |
| 2
|
Preparedness | Q24a | 0.39 | 711 | 0.000 |
| 2
|
Preparedness | Q24bS | 0.37 | 711 | 0.000 |
| 2
|
Preparedness | Q26aS | 0.41 | 711 | 0.000 |
| 2
|
Preparedness | Q26aHB | 0.37 | 711 | 0.000 |
| 2
|
Preparedness | Q26aA | 0.48 | 711 | 0.000 |
| 2
|
Preparedness | Q26aPP | 0.44 | 711 | 0.000 |
| 2
|
Preparedness | Q26aWP | 0.36 | 711 | 0.000 |
| 2
|
Preparedness | Q26bS | 0.38 | 711 | 0.000 |
| 2
|
Preparedness | Q32 | 0.37 | 711 | 0.000 |
| 3
|
Risk Prevent | Q27_1 | 0.62 | 635 | 0.000 |
| 3
|
Risk Prevent | Q27_2 | 0.67 | 635 | 0.000 |
| 3
|
Risk Prevent | Q27_3 | 0.83 | 635 | 0.000 |
| 3
|
Risk Prevent | Q27_4 | 0.77 | 635 | 0.000 |
| 3
|
Risk Prevent | Q27_5 | 0.74 | 635 | 0.000 |
Table 2. Final sample sizes ( n ), and inter-iteration correlations ( r ) between indices
| Index Name | n
|
r
|
|---|---|---|
| Exposure
|
710 | 1.00 |
| Preparedness
|
713 | .93 |
| Risk
|
637 | .98 |
The Exposure items remained the same from iteration 1 to iteration 2. They related to: their perceived likelihood of being caught in a bushfire in the next 1 year/5 years; the number of bushfires they had seen on TV in past year; the number of bushfires they had seen in their area; if they had personally encountered a bushfire and how close that bushfire was to them. The Preparedness items reduced to the essentials of knowledge about emergency phone numbers, evacuation plans, having phone access, fire fighting equipments and tools, and access to water. From the second iteration of Table 1, the items remaining as risk factors were only those from the responses to Q 27. We can only deduce that the main significant risk factors (listed as Risk Prevent in the above Table 1b) that prevented residents from being prepared for bushfires were: lack of skills, resources and time. They lacked assistance, had insufficient equipment, probably because it was expensive, and other priorities competed for their time and energy. These were the issues that respondents endorsed as preventing them from preparing for bushfires.
Thus it could be then that these could be the main reasons that are preventing those people with personal experience of fires to take action to mitigate the effects of bushfires on their property at a future time.
Final sample sizes, and the inter-iteration correlations, which indicate good stability of the index calculations are outlined now. Table 3 outlines the inter-index correlations, which indicate small, but statistically significant, correlations between bushfire exposure and preparedness (r = .16), and risk factors and preparedness (r = -.19). These associations can be visualised in Figures 2 and 3 respectively.
Table 3. Inter-index correlations ( r ), statistical significances ( p ), and sample sizes ( n )
| Index Name | Exposure | Preparedness | |
|---|---|---|---|
| Preparedness |
r
|
.16
|
|
| p
|
<.001
|
||
| n
|
710
|
||
| |
|||
| Risk
|
r
|
.07
|
-.19
|
| p
|
.09
|
<.001
|
|
| n
|
635
|
637
|
Figure 2. Bushfire Exposure and Preparedness, and their
Association.
Note: The red line is fitted by a spline routine and visualises the association
between the axes.

Figure 3. Risk Factors and Preparedness and their Association between the axes.
The qualitative responses to questionnaire item Q31B (How close was that fire to you) were categorised into four groups of "personal experience" [1: property burned; 2: very close (at most 50 metres); 3: close (more than 50 metres to at most 400 metres); and 4: none of the previous (see Table 4], as shown in Figure 4.
Figure 4. Preparedness and Bushfire Exposure, and the
Grouping by "Personal Experience".
Note: The red line is fitted by a spline routine and visualises the association
between the axes.
The visual impression from Figure 3 is that the personal experience of having one's property burned is associated, on the whole, with greater preparedness (although this is clearly not uniformly true). This is borne out by formal statistical analyses of the preparedness index, detailed in Table 4. A MANOVA establishes that there is an overall significant effect of "personal experience" on the three indices (Wilk's λ = 0.87, p < .001), with results for individual indices presented in Table 4 detailing: (i) for preparedness, significant differences between levels of "personal experience"; (ii) for bushfire exposure, no significant differences among commented levels of "personal experience", and highly significant differences between commented levels and the "other" (uncommented) level; and (iii) for risk factors, no significant differences among levels of "personal experience". (The terms commented and uncommented refer to whether or not the survey participants had made comments about their personal experience within the survey notes section.)
Table 4. Preparedness, Bushfire Exposure, and Risk Factors, by "Personal Experience"
| Personal Experience/Closeness of bushfire | Preparedness
|
Exposure
|
Risk
|
|
|---|---|---|---|---|
| Property
burnt
|
m
|
107.7
|
108.7
|
96.0
|
| s
|
(13.0)
|
(11.9)
|
(14.7)
|
|
| Very close
(≤50 metres)
|
m
|
100.1
|
107.3
|
101.7
|
| s
|
(14.7)
|
(13.7)
|
(14.7)
|
|
| Close
(51-300 metres) |
m
|
103.8
|
106.3
|
99.0
|
| s
|
(13.0)
|
(12.9)
|
(15.9)
|
|
| Other |
m
|
100.1
|
97.3
|
100.0
|
| s
|
(14.4)
|
(14.7)
|
(14.8)
|
Summary analyses of variance for preparedness, exposure, and risk factors, according to levels of "personal experience"
| Source of variation | df | Preparedness | Experience | Risk | |||
|---|---|---|---|---|---|---|---|
| F | p | F | p | F | p | ||
| Personal experience | 3 |
3.73 |
.01 |
23.0 |
<.001 |
1.31 |
.27 |
| Levels {B VC C} | 2 |
3.88 |
.02 |
029 |
.75 |
1.96 |
.14 |
| Burnt (B) v. Other | 1 |
8.14 |
.005 |
18.67 |
<.001 |
2.08 |
.15 |
| Very close (VC) v. Other | 1 |
0.16 |
.98 |
44.24 |
<.001 |
1.11 |
.29 |
| Very close v. Burnt | 1 |
6.90 |
.009 |
0.22 |
.64 |
3.51 |
.06 |
| Close (C) v. Other | 1 |
3.58 |
.06 |
22.65 |
<.001 |
0.26 |
.61 |
| Close v. Burnt | 1 |
1.60 |
.21 |
0.57 |
.45 |
0.84 |
.36 |
| Close v. Very Close | 1 |
2.67 |
.10 |
0.20 |
.65 |
1.32 |
.25 |
It is important to remember, as we discuss these findings, that “personal experience” dealt with the closeness of the fire and actual negative encounters and traumas caused by the bushfire. From Table 4, one can determine that the level of preparedness increased incrementally the closer the fire had moved towards the person and/or their property. This pattern holds true for Exposure, although that may be accounted for by the fact that once a person has been threatened so severely by a bushfire, that their perceptions of the likelihood of being caught in a fire again is heightened, and thus they are more likely to be more attuned to TV news reports on fires and obviously are more likely to have seen a fire with their own eyes.
In determining where the differences lay, the summary analyses section of Table 4 indicate an overall effect for close encounters with fires. There is a definite view that personal close encounters with fires, impacted positively on preparedness. This was clearly evident in the difference between the burnt group and all others, as no doubt could be expected, but it existed even between the groups who had “faced off” the fires. For instance, between those who had actually been burned (burnt) and those for whom the fires had come within 50 metres of them (very close), there was a significant impact on better preparedness.
The old maxim of " being burnt" was something that these rural residents would not forget and while they might not have all the skills, resources, and time to do many of the things they knew were important, they were ready with a plan, knew where to obtain information and had the key contacts to phone in case assistance or evacuation was necessary.
In terms of linking these findings to other research, there was no research that we could locate that had investigated the discrimination in distances from the actual bushfires in terms of future preparedness.
There seems to be no doubt that experience with fire is the best teacher, and the old adage of seeing is believing is just not true, unless one sees the fire on the doorstep. After speaking with residents in these shires now about the fires that occurred in 2004/2005, it is clear that they are a thing of the past and hold no inherent meaning for the large percentage of the population. This may be because all their energies have been consumed by concerns about lack of water following the worst drought in more than 160 years, the dramatically increasing fuel prices and continuing rising interest rates and high food and grain prices which spell death to country areas. [These drought and fire events occurred before the world financial market crash in late 2008 and before any of the storms and floods in November/December 2008 had occurred.]
Or it may be because while they were exposed to fires, they were not personally affected by them – they had escaped. However, those residents who were seriously affected by the fires have not forgotten and live in fear about future fire storms.
According to Ellis, Kanowski and Whelan (2004, p. 42): "Experience is a central factor in motivation, and the more recent the experience the better.” However, this does not mean that they are totally prepared, because as indicated in their responses, many of them do not have the time, resources or assistance to continually make their properties fireproof.
There are implications of these findings for emergency services and government education campaigns that are aimed at warning residents to be better prepared for increased bushfire activity. Climate variability has led to the majority of some states being drought declared over the past six years in Australia. With drought, there has been more susceptibility for bushfires and less or no water with which to fight fires in rural areas. Education campaigns can now link the public’s heightened awareness and concern with respect to global warming and climate change and the need to be, and remain prepared for, bushfire emergencies.
The authors suggest a new byline to the normal message on bushfires and to keep using the 5 steps as outlined below:
Don’t let this happen to you! Bushfires burn people, animals, forests, grasslands and property.
With global warming, and the recent history of prolonged drought, there is a definite likelihood of more bushfires in Australia. Be prepared; follow these simple steps in preparation:
• Clear scrub and undergrowth around your property
• Keep grassed areas well trimmed and watered
• Clear your gutters of leaves and rubbish
• Store flammable items well away from the house
• Make sure you have hoses and reserve water supplies available.
(www.fire.qld.gov.au)
Three indices were derived from responses to certain questionnaire items in order to capture the constructs of exposure to bushfires, preparedness, and risk factors. The results clearly showed that the closer a person has been to a fire in the past influences their efforts in fire preparedness in the near future (around 12 months). The analyses also exacted out the fact that indeed there are differences between fire preparedness levels of people who have had personal encounters at very close hand with fire (the fire came up to their property boundaries) and those who were severely affected by the bushfires (they were burnt, had house or property or livestock destroyed).
Given what has been demonstrated in this study with respect to preparedness, the concern arises about what is going to happen in the next few years in this area as well as most parts of Australia where there is a predicted increase in the population in rural areas close to cities (Queensland Government, 2005) and an expansion of the city boundaries into forest and grass farmland areas .
As Pritchard and Gow (2008) have pointed out, more research needs to be carried out in the area of preparation for bushfires, and this is particularly true of the urban/rural fringe areas, in order to determine people’s awareness of the risk of bushfires and their preparedness for such natural disasters.
Acknowledgement:
The researchers would like to thank the rural residents who participated in
the survey and the Queensland University of Technology for its research funding
contribution.
ACT Coroner's Bushfire Inquiry. (2006). The Canberra Firestorm: Inquests and Inquiry into four deaths and four fires between 8 and 18 January 2003. Maria Doogan, Coroner. Canberra: ACT Coroners Court. Retrieved from the web December 12, 2007. http://www.courts.act.gov.au/BushfireInquiry/The_Canberra_Firestorm_Report/The_Canberra_Firestorm_Report.htm
Anderson, J. W. (1968). Cultural Adaptation to Threatened Disasters. Human Organization, 27, 298-307.
Bandy, R., Johnson, A., Peek, L. & Sutton, J. (2004). Public Hazards Communication: Annotated Bibliography. Natural Hazards Centre, University of Colorado, Boulder.
Bureau of Meterology September 13, 2007. Retrieved from the web December 31, 2007. http://www.bom.gov.au/inside/services_policy/fire_ag/bushfire/threat.htm.
Childs, I., Pritchard, F., Gow, K., & Hastings, P. (2006). Bushfire preparedness of rural-residents in selected Southeast Queensland shires. Social Change in the 21st Century Conference. Retrieved from the web January 1, 2007. http://www.socialchange.qut.edu.au/conferences/socialchange/2006proceedings.jsp
Clack, P. (2003). Firestorm: Trial by Fire. Milton, Australia: John Wiley & Sons.
Collins, P. (2006). Burn: The epic story of bushfire in Australia. Crows Nest, New South Wales: Allen & Unwin.
Commonwealth of Australia (2003): A Nation Charred: Inquiry into the recent Australian Bushfires October 2003, The Parliament of the Commonwealth of Australia, House of Representatives Select Committee on Recent Australian Bushfires, Canberra.
Ellis, S., Kanowski, P. & Whelan, R. (2004). National Inquiry on Bushfire Mitigation and Management. Canberra: Commonwealth of Australia.
Farley, J. E. (1993). Public, Media, and Institutional Responses to the Iben Browning Earthquake Prediction. International Journal of Mass Emergencies and Disasters 11(3), 271-468.
Flynn, C. B. & Chalmers, J.A. (1980). The Social and Economic Effects of the Accident at Three Mile Island. Washington, D.C.: Nuclear Regulatory Commission.
Foster, H. D. (1980). Disaster Planning: The Preservation of Life and Property. New York, NY: Springer-Verlag.
Gow, K. (2006). How psychological theories can help make sense of residents lack of preparedness for Bushfires. Paper presented at the APS/NZPS Conference, Symposium: Addressing Disasters: From threats to risk communication to preparedness, Auckland: SKYCITY Auckland Convention Centre.
Hodler, T. W. (1962). Resident's Preparedness and Response to the Kalamazoo Tornado. Disasters 6 (1), 44-49.
Moore, H. E., Bates, F.L., Layman, M.V. & Parenton, V.J. (1963). Before the Wind: A Study of Response to Hurricane Carla. Washington, D.C.: National Research Council, National Academy of Sciences.
Perry, R., & Greene, M. (1983). Citizen response to volcanic eruptions: The case of Mount St. Helens. New York: Irvington Publishers, Inc.
Perry, R. (1979). Evacuation decision-making in natural disasters. Mass Emergencies, 4, 25–38.
Pritchard, F. & Gow, K. (2008). Bushfires: Preparation, Resilience & Recovery. In K. Gow & D. Paton (Eds.). The Phoenix of Natural Disasters: Community Resilience. New York: Nova Science Publications.
Queensland Government (2005) Population Growth – Highlights and Trends, Queensland 2005. Planning Information and Forecasting Unit, Dept. of Local Government, Planning, Sport and Recreation.
Rhodes, A & Reinholtd, S. (1999). A framework for understanding and monitoring levels of preparedness for wildfire. Disaster Prevention for the 21st Century. Proceedings of the Australian Disaster Conference, 1-3 November. Emergency Management Australia, Canberra, pp. 135-140.
Rohrmann, B. (1999). Community-Based fire preparedness programmes: An empirical evaluations. The Australasian Journal of Disaster and Trauma Studies, 1, http://www.massey.ac.nz/~trauma/issues/1999-1/rohrmann.htm
Sorensen, J. H. (1982). Evaluation of Emergency Warning System at Ft. St. Vrain Nuclear Power Plant. Oak Ridge, TN: Oak Ridge National Laboratory.
Williams, H. B. (1957). Some Functions of Communication in Crisis Behavior. Human Organization, 16, 15-19.
Windham, G. O., Posey, E.I., Ross, P. J. & Spencer, B. (1977). Reaction to Storm Threat during Hurricane Eloise. Starkville, MS: Social Science Research Center, Mississippi State University.
Websites Relating to Bushfire Management referred to in Article
Blue Mountains Bushfire Management Committee (1997). Accessed 25.01.08. http://www.bmcc.nsw.gov.au/download.cfm?f=9D22BF66-AE40-9F6C-B80D046E927DC95C
Crows Nest Shire Council, Department of Natural Resources. (Accessed 25.01.08)
www.coagbushfireenquiry.gov.au/subs_word/tran/31_1_coag_bushfire_inquiry_seqfabc_submission(final).doc
Esk Shire Council. Emergency Management Strategies. (2006) (Accessed 25.01.08). http://www.esk.qld.gov.au/content/Services/counter_disaster.htm
Gatton Shire Council. Bushfire Threat Specific Arrangements. (Accessed 25.01.08). www.health.qld.gov.au/emerg_serv/11201intro.pdf
Kilcoy Shire. Town plan for Kilcoy Shire. Flood, Bushfire and Landslide (for
Bushfire, Flood and Landslide). (Accessed 25.01.08)
www.kilcoy.qld.gov.au/council/minutes%20pdf/April%2028%202006.pdf
Laidley Shire Council. (Accessed 25.01.08). www.laidley.qld.gov.au/.../Planning%20and%20Development/IPA%20Planning%20Scheme/IPA%20Scheme%20Map%20d.pdf
Laidley Shire Council. Bushfire Risk Analysis for Laidley Shire (2002). Rural Fire Service. Laidley Shire Major Infrastructure. (Accessed 25.01.08).www.laidley.qld.gov.au/.../Docs/Engineering %20and%20Assets/LaidleySC-Risk-Study-Final%20Draft%2019%20Oct.pdf
Mornington Peninsula Shire. (2006). Bushfire prone areas. (Accessed 4.11.08). http://www.mornpen.vic.gov.au/page/Page.asp?Page_Id=416&h=-1
South Australian Metropolitan Fire Service. Bushfire prevention and preparedness (2006). http://www.samfs.sa.gov.au. (Last accessed 25.01.08).
Wingecarribee Bush Fire Management Committee Plan. (2001). (Accessed 25.01.08).
http://www.wsc.nsw.gov.au/printversion/1710.html
| Comments to Trauma.Webmaster@massey.ac.nz Massey University, New Zealand URL: http://trauma.massey.ac.nz/ |
Disclaimer
Last changed
December 12, 2008
|