
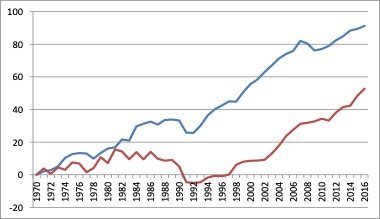
A graph showing GDP (blue) per capita growth vs GPI (brown) per capita.

Report cover.
Lead author and ecological economist Professor Murray Patterson says the report is based on an alternative economic model that offers a reality check, as the country waits for the Government’s first Wellbeing Budget.
“Overall, on a per capita basis, since 1970, the GDP increased by 91 per cent,” Professor Patterson says. “whereas the Genuine Progress Indicator (GPI), which gives a more accurate measure of the nation’s wellbeing, only increased by 53 per cent.”
Beyond Gross Domestic Product: The New Zealand Genuine Progress Indicator to Measure the Economic, Social and Environmental Dimensions of Well-Being from 1970 to 2016, is comprehensive 204-page report, compiled from data collected over nearly five decades, presents a sobering picture of how our society has developed under a range of 21 indicators. These include the traditional measure of personal consumption, as well as additional areas of income inequality, unemployment, public services, commuting, crime, biological pests, air pollution, ozone depletion, greenhouse gases and loss of wetlands, indigenous forests and soil.
“When you look at personal consumption of goods and services, we’ve done very well – tracking up steeply, as the GDP. But when you take away the costs, you get this different picture which is not quite so rosy,” Professor Patterson says.
“In terms of economic management it shows that from 1970 to 1992 country went backwards when you look at all the costs and benefits, then from 1990 onwards, we got the economy basically right. People were consuming lots of goods and services as reflected in the GPI. So we got the economy right but we got everthing else wrong.”
And though some are better off financially since the 1990s compared with the previous 20-year period, the environment has suffered considerably.The report conservatively costed overall deterioration of the natural environment at $18.3 billion for 2016.
“The most significant environmental cost was air pollution with an economic cost of $5.1 billion for 2016, based on air pollution causing premature deaths and restricted activity days, as well as negative health effects such as respiratory and cardiac illnesses.”
Other key environmental impacts include human-induced soil loss and erosion, resulting in the loss of productive land, increasing flood severity and damage to property, cost $3.5 billion for 2016.
More report highlights:
-
Greenhouse gas emissions more than doubled between 1970 to 2016. Forestry plantings and other land-use changes nullified this effect to some extent, but there was still a net increase of greenhouse gases of 24 per cent, having an economic cost of $3 billion in 2016.
-
Water pollution is the fourth largest environmental cost, mainly due to the intensification of agriculture through greater numbers of dairy cattle. The economic cost of this jumped from $1.5 billion in 1992 to $2.4 billion in 2016.
-
Other environmental costs: the loss of wetland ecosystem services, noise pollution, cost of biological pests, cost of solid wastes disposal and contaminated sites, ozone depletion and loss of indigenous forests, which collectively all had an economic cost of $4.3 billion in 2016.
-
Consumption (under GPI) dropped by 23 per cent due to growing income inequality over the 1970 to 2016 period. Income inequality does not only mean that poorer people consume less goods and services, but impacts on the decline in social cohesion, negative medical and mental health outcomes associated with poverty, limited access to education and other barriers to well-being.
-
Time poor population: more time is wasted in commuting to work, as transport infrastructure has not kept pace with economic growth – in 2016 the time lost in commuting costs was of $7.1 billion.
About the report:
The report is the culmination of 10 years’ of work and $1m central Government funding and some co-funding from regional and city councils funding, is a wake-up call for citizens and politicians alike, its authors say. The project was originally funded by the Government’s Foundation for Research Science and Technology (2003-2009), and recently (2017-2018) the data have been updated to 2016 with some significant methodological and technical improvements being made to the estimates.
Read full report here.