 |
The Waikato Regional Flood |
|
|
The Waikato Regional Flood |
Abstract
This report gives a brief synopsis of the recent flood event on the Lower Waikato River, located approximately 50 km south of Auckland, New Zealand. Extremely high river levels were experienced on the Waikato and Waipa Rivers between 9-20 July due to widespread, and in places record rainfall. As a result, urban centres including Hamilton, Ngaruawahia, Huntly, and Mercer were inundated. Farms adjacent to the Waipa River, Whangamarino Wetland, and properties fringing Lakes' Taupo and Waikare were also affected. This event came off the back of a previous deluge that occurred only a week before. These back to back deluges (along with already saturated ground conditions) and successive frontal bands meant that rivers were unable to cope with the copious amounts of water entering the catchment. Flood warnings and management systems generally worked very well, and the Lower Waikato Waipa Control Scheme performed as per design.
The design rainfall frequency for the Lower Waikato Waipa Control Scheme is 200-250mm over three days.
The 7-day total rainfall from 8-15 July for the relevant rainfall recorders are presented
in Table 1. Most of the rain fell 9-11 July, with Ngaroma (near Te Kuiti) receiving its
July normal in less than two days. The 7-day figures are compared with rainfall in a
'normal' July.
| Rainfall Site | Catchment | 8-15 July 1998, mm | Normal July, mm | % Above Normal | Feb 1958, mm |
|---|---|---|---|---|---|
| Waikato/Waipa Catchments | |||||
| Pukekawa | Lower Waikato | 165 | 150 | 10 | - |
| Mangatangi | Mangatangi | 316 | 207 | 53 | - |
| Maungakawa | Mangawara/Piako | 202 | 150 | 35 | 325? |
| Hamilton | Waikato | 191 | 123 | 55 | 324 |
| Otewa | Waipa | 196 | 155 | 26 | - |
| Ngaroma | Waipa | 361 | 223 | 62 | 340 |
| Te Kuiti | Mangaokewa | 260 | 170 | 53 | - |
| Hauraki/Coromandel Catchments | |||||
| Smiths | Kauaeranga | 165 | 130 | 27 | - |
| Pinnacles | Kauaeranga | 460 | 435 | 6 | - |
| Golden Cross | Ohinemuri | 273 | 296 | -8 | - |
| Maukoro | Piako | 172 | 120 | 43 | - |
| Waharoa | Waitoa | 138 | 128 | 8 | - |
| Wharekawa | Waihou | 275 | 250 | 10 | - |
| Te Aroha | Waihou | 150 | 166 | -11 | - |
| Kaimai | Waihou | 370 | 175 | 111 | - |
| Taupo/Awakino Catchments | |||||
| Wharekiri | Mangaokewa/Waipa | 250 | 197 | 27 | - |
| Waitanguru | Awakino/Mokau | 286 | 304 | -6 | - |
| Turangi | Tongariro | 195 | 150 | 30 | 507 |
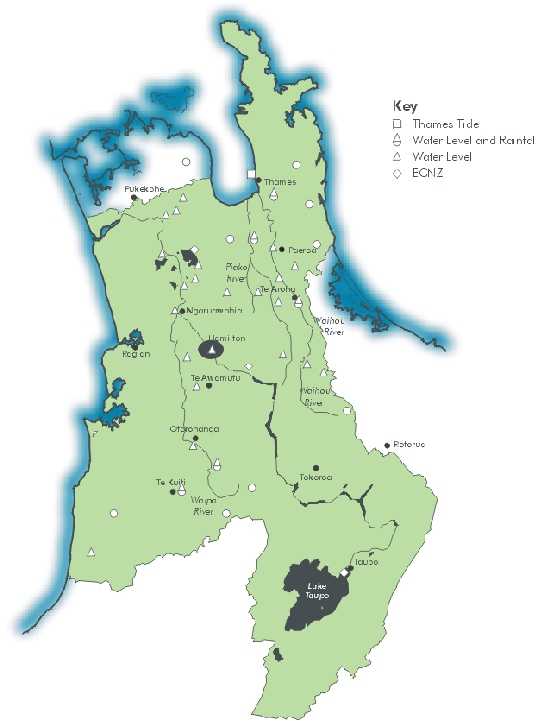
Figure 1 : Map of the Waikato Region, showing the major rivers affected in this flood event.
River Flows
Recorded peak flows are presented in Table 2 below.
| Location | Peak Flow July 1998 and typical values (cumecs) | Peak Date July 1998 | Comparison cumecs | |
|---|---|---|---|---|
| Taupo/Awakino Rivers | ||||
| Poutu Intake (Tongariro) | 660 | - | 9th | 572 on 2/7/98 |
| Tauranga-Taupo | 218 | 13 | 10th | 204 on 2/7/98 |
| Awakino @ SH3 | 282 | - | 9th | - |
| Waipa/Waikato Rivers | ||||
| Mangaokewa @ Te Kuiti | 122 | 11 | 9th | 87 on 2/7/98 |
| Waipa @ Otewa | recorder damaged durning flood | |||
| Waipa @ Otorohanga | 418 | 52 | 10th | 625 in 1958 |
| Waipa @ Whatawhata | 776 | 165 | 13th | 1130 in 1958 |
| Waikato @ Hamilton | 807 | 306 | 15th | 905 in 1958 |
| Waikato @ Ngaruawahia | 1491 | 456 | 12th | 1482 in 1958 |
| Waikato @ Huntly | 1490 | 490 | 15th | 1540 in 1958 |
| Waikato @ Rangiriri | 1490 | 507 | 15th | - |
| Waikato @ Mercer | 1575 | 545 | 16th | 1260 in 1958 |
| Hauraki Basin/Coromandel Rivers | ||||
| Waihou @ Okauia | 180 | 33 | 11th | - |
| Waihou @ Te Aroha | 190 | 53 | 16th | - |
| Waihou @ Puke Bridge | (tidal) | - | 15th | - |
| Waitoa @ Waharoa | 25 | 3 | 12th | - |
| Waihou @ Mellon Rd | 68 | 11 | 12th | - |
| Piako @ Kiwitahi | 72 | 4 | 11th | - |
| Piako @ P-T Road | 168 | 17 | 12th | - |
| Piako @ Maukoro Landing | (tidal) | - | 13th | - |
| Kauaeranga @ Smiths | 353 | 11 | 26th | - |
| Ohinemuri @ Karangahake | 295 | 21 | 15th | - |
The Taupo control gates were again set to minimum on 15 July to reduce lower Waikato
River levels. Between 16-17 July, river levels generally declined, with Lake Taupo
swelling to its highest level in 40 years (357.49 m) due to continued high tributary
input. In fact, it has been calculated that the total inflow for Lake
Taupo for July 98 is the biggest monthly inflow since records began in 1905.
The Tongariro Power Development scheme (diversion of foreign waters) was shut down
when Lake Taupo reached its winter maximum control level of 357.25 metres.
On 17 July, Lake Taupo control gates and Karapiro Dam discharges were increased to
reduce Lake Taupo levels. The control gates were maintained at their maximum setting
until the level of lake fell significantly below the winter maximum control level of
357.25 m (this was reached on Monday 3 August, more than two weeks after the gates
were fully opened).
The main effects from these high lake levels were:
Stormwater:
Number of outfalls damaged, and capacity of system reduced (fortunate
that there was no heavy rain event during this time).
Sewerage:
Five Mile Bay and Waitahanui worst affected. Infiltration into system was
four times the normal flow. Septic tanks still exist in the area, many overflowed into
main system due to the high lake levels (not designed for those levels). Not too many
problems experienced with this increase.
Note: maximum lake levels for planned storage are 357.14 m and 357.25 m, for
summer (January-March) and winter (April-December) respectively. The maximum
level is lower in summer because cyclonic rainfall is more likely then.
It has become apparent that the tributary inflows into the Waikato system between Karapiro and Mercer were significant (0.4 cumecs / km2 between Karapiro and Hamilton, as opposed to 0.12 cumecs / km2 between the dams).
It is apparent that the volume of water entering the Waikato system from minor tributaries between Karapiro and Mercer played a relatively major role in contributing to the flood levels experienced on the lower Waikato.
The peak discharge from Karapiro was 550 cumecs on 12/7/98. At Hamilton, the flow
had increased to 750 cumecs due to another 200 cumecs entering the system between
the two locations.
Without the effect of the hydro dams and the option to use Lake Taupo as a flood storage area, peak flood levels at Hamilton, Huntly, and Mercer would have been 1 metre, 0.5 metres, and 0.1 metres higher respectively.
Many farms that fringe the lake were inevitably flooded as the local stopbanks (i.e.
private) were overtopped. Likewise, some farms fringing the Whangamarino wetland
were also inundated due to the swollen Maramarua and Whangamarino Rivers which
continued to infill the wetland above private stopbank levels while the control gate remained
closed.
Since the establishment of the Lake Waikare gate, the lake level can now be artificially
controlled between 5.50-5.65 m. In pre-gate days, the average level of the lake hovered
around 6.5 m (0.21 m higher than the flood peak in July 1998). The highest lake level
on record is 8.38 m (1958). The design flood level of the scheme (when lake
floodwaters actually flow over farmland and into the wetland) is 7.37 m. In this event,
approximately 1.7 km2 of land was flooded by Lake Waikare.
The Whangamarino Wetland area swelled from its normal 17 km2 to 67 km2 in this
event as opposed to 126 km2 in the 1958 flood. Without the presence of the gates, the wetland level would have been equal to the Waikato River level of 6.11 m or an extra
73 km2 of land underwater, potentially totaling 140 km2).
The flood alert levels for the Hauraki/Coromandel Rivers reached 4 in some areas.
The Flood Operations Centre was activated on Thursday 9 July at 11:00 pm. From that
point on (until Monday 20 July), river levels and rainfall patterns were monitored by staff 24
hours per day. The telemetry system switched from normal day/night mode into alert
mode meaning that sites were being polled (updated) every hour, instead of the usual 3
hours.
Environment Waikato flood duty staff kept in constant contact with district councils, ECNZ and residents living on or near the Waikato/Waipa Rivers, advising them of expected peak
levels and times. Predicting the arrival of the peaks became a difficult exercise with the
onset of more heavy rain, and the already high river levels from the previous event.
Regular contact was also made with the Paeroa Flood Response Officers in regard to
the Piako River flood situation.
Flood warning recipients were notified by phone, fax, email, and/or paging. The 0832
Infolines were also operational during the event, and staff encouraged customers (where
relevant) to use it as much as possible. Telecom has since advised that the
Waipa/Waikato Infoline had a 335% increase in the number of calls between 1-20 July,
taking pressure off key staff in the flood control centre.
Due to the complexities of this event, decisions at times were made with limited
information available. Circumstances also changed very quickly, and were
unpredictable.
The guidelines outlined in the above reports have been tailored specifically for the
whole Waikato River system (i.e. including Lake Taupo, Waipa River, and other
tributaries and designated flood storage areas). These are derived from many years of
historical data, knowledge, and experience by the various scheme managers.
The peak flow in the Awakino River Taupo (estimated to have a probability of
occurrence in any one year of 20% (5 year flow) inundated SH 3, and the road was
closed due to flooding and slips.
The peak flows in the upper Waipa were the highest recorded since 1958. The peak
flows at Otewa and TeKuiti were estimated to have a probability of occurrence in any
one year of 1% (100 year flow), and a peak flow at Otorohanga of about 2% (50 year
flow), and at Whatawhata approximately a 1.5% probability of occurrence (80 year
flow).
The peak flows in the lower Waikato system from Ngaruawahia to Mercer hovered
between a 2% (50 year flow) and a 1% (100 year flow) probability of occurrence,
which were in places higher than the 1958 peak flow. The peak flow at Mercer reached
a level of 6.11 metres, inundating unprotected areas of the floodplain in this locality,
including the Morrison Road basin and the Mercer riverbanks which are located outside
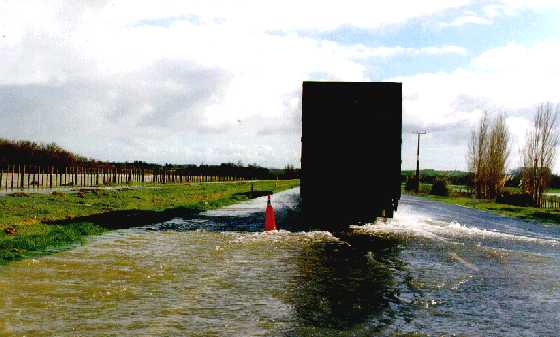
the scheme area. The Rangiriri Spillway operated as designed for the first time in 28
years (Figure 3).
The nature of the second deluge was to produce high flows in all catchment areas (i.e.
upper and lower) due to record rainfall that was fairly widespread. The flood wave
increased in severity as it moved downstream due to the heavy input from the middle
and lower Waikato tributaries. This was paramount in the lower Waikato as the peak
flow from the Waikato Hydro system passed through Ngaruawahia before the Waipa
peak flow arrived.
Over time, controlling the timing of the peaks proved extremely difficult due to continued rainfall, which either re-elevated river levels or attenuated the peak flow.
This meant that the Waikato peak flows through Hamilton, and the Waipa peak flows
through Whatawhata were sustained at a very high level for some time.
The normal time of travel for flows between Otorohanga and Whatawhata is about 16
hours, but this peak took about 90 hours to reach Whatawhata.
Hauraki/Coromandel Rivers
The peak flow in the upper Waitoa river system equated to a 5% (20 year flow)
probability of occurrence in any one year.
The Piako Ponding Zones were used for the first time as per the Piako River Scheme
design, with significant flooding occurring in these zones.
Provisional Flood Damage - Rural
It is estimated that 1000-1500 hectares of farmland were flooded, predominantly in the
lower Waikato area. Information provided from Federated Farmers indicate that about 9
farms were completely under water, with another 30-40 partially affected.
Provisional Flood Damage - Residential
The following residential areas were reported to have suffered some form of flood
damage:
It has been estimated that the costs for the Waikato Region in regard to state highway
damage will lie somewhere between $7-9 million. This includes costs of about $5
million for the large slip on SH 3 near Mohoenui. The total cost is expected to top $17 million, including damage to the protection scheme, infrastructure, farms, and property.
Flood flows in the Tauranga-Taupo, Tongariro, Waipa, and Waikato River systems in
this event have been regarded (at some sites) as being larger than the 1958 flood, but
not quite rivalling the 1907 event. Hence, the Alert Level assigned to these systems
reached 5 (major flooding, minor roads flooded, and major flows in river system).
Flood warnings and management systems generally worked very well, and the Lower
Waikato Waipa Control Scheme operated better than design in many places. The
general reaction from the community, both from the urban and rural sector, has been
extremely positive.
It should be noted that the majority of the previous major flood events that are commonly
referred to, occurred during the summer period (i.e. cyclone originated), whereas this
event has been out of the norm occurring during the winter months.
MetService have since indicated that a very warm north Tasman Sea provided the
energy for the successive depressions that formed during July, bringing with them the
active rainfall bands that resulted in this flood.
