| Nimeshika Pattabiraman <Nim> |
| |
I came to New Zealand in Autumn 2017 to pursue a Master of Science in Conservation Biology at Massey University following my Bachelor of Engineering degree in Biotechnology (Bangalore, India). The shift in streams was brought about by my final year undergraduate project- A comparative study of genetic diversity in tiger populations (Panthera tigris tigris) from Central India and Southern India. Although this was a minor project, the aspects of a more research oriented career took my interests.
|

|
PhD research:
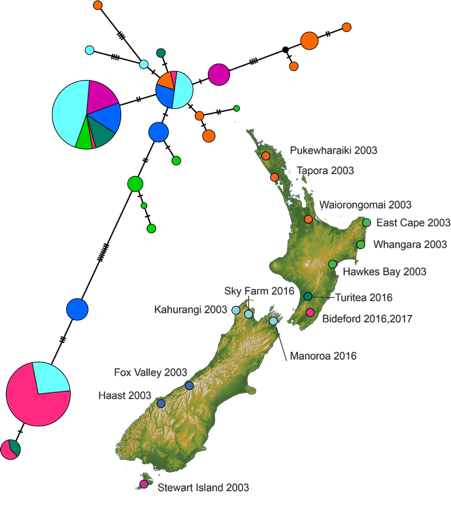
Brushtail possums were introduced to New Zealand in the mid 1800s to establish the fur industry, but have since negatively impacted the country’s flora and fauna. They are carriers of bovine tuberculosis which affect the dairy industry and consequently the economy. There is little information on the intermixing of populations (migration rates) and how this has affected the distribution of genetic diversity across New Zealand. During MSc research I generated and analysed data using mitochondrial and microsatellite markers for samples from 19 locations ranging the country (network of mtDNA haplotypes: right). This was done as a foundational study for further research into their spatial structure for the project: Landscape genetics of brushtail possums (Trichosurus vulpecula) in New Zealand for conservation management.
As of June 2019 I have started my PhD focussing on fine-scale analyses of some populations, to observe migration rates associated with population density fluctuations post management actions. I have historical samples (2003) as well as current samples from different environments (urban, pasture, forest) providing an adequate spatial and temporal range to the outcome.
|
|
Background:
Following the introduction of about 100 brushtail possums to New Zealand in 1837, the feral possum population in New Zealand grew to ~48 million, leading to the transmission of TB and damage to native biota. New Zealand spends ~$100 million a year controlling possums, primarily through application of 1080 to >8 million hectares/year. Abundant genetic diversity in New Zealand possums, arising from their origin from several Australian populations, is indicated by colour polymorphism (rust, black, grey), varying responses to 1080 and trapping, and preliminary genetic surveys. Estimation of kill rates and rates of population recovery depend primarily on trapping and poisoning. These methods cannot differentiate between population increase from survivors and immigration. However, population genetic methods can allow simultaneous estimation of population increase and migration (gene flow), and is essential for an integrated approach to monitoring and management. This adaptive management approach will help integrate the objective of TB control, with the accumulating information that will help our ability to reach the TBfree goal by identifying and assisting the resolution of areas of uncertainty.
Without direct observation of possum individuals, or the use of expensive GPS tools the only way to get a clear idea about population size and rates of movement of among populations (= migration in population genetic terms) is through the use of multilocus population genetic markers. Thus the most immediate task is to rectify the near absence of spatial population genetic analysis of brushtail possums in New Zealand. We will collate existing, fragmentary, population genetic data obtained using microsatellite markers and attempt to cross-reference these data from early surveys with new surveys to allow direct comparison. The mosaic of possum population control measures will result in different rates and modes of regional population recovery fuelled by local recruitment and migration. Therefore, to better estimate changes in population composition through time (from generation to generation) genotyping will include populations sampled more than once through time.
|
|
Bovine TB:
This project is part-funded by OSPRI as we develop better tools for understanding possum population dynamics which has a bearing on their transmission of bovine tuberculosis. Two factors are fundamental to the future success of TB eradiation through possum (host) management. One is the need for a robust model of the population biology of possums, and the other is understanding the evolutionary ecology of 1080 (and other toxins). In New Zealand, poisoning results in local possum kill rates that are high, but poisoning events are periodic and unevenly timed across the country. Possum control has historically been managed regionally. Even within regions, control practices vary in response to opportunity and objective, although a streamlined regulatory regime (amendment to RMA) since April 2017 makes it easier to coordinate activity on a national scale. Nevertheless, aerial application of 1080 is not appropriate in all settings and different objectives of agricultural and environmental pest management, on top of societal animal welfare and health concerns, will continue to create spatial heterogeneity of possum populations.
Management with toxins is directed mainly at controlling possum numbers where they are of most concern (for TB spread and/or native biodiversity). This yields a complex pattern of possum population density across the country, and repeated bouts of “natural” selection in space and time have the potential to drive adaptive responses in possums that further complicate spatial demographics. As a result of multiple introductions, the genetic diversity among New Zealand possums is unusually high, yielding rich potential for genetic adaption to a variety of selective pressures, including toxin resistance. We will use population genetic data from old and new sampling of possums across New Zealand, along with comparative material from Australia, to develop a dynamic national model of population sizes and rates of inter-population (region) migration. Without this information on a national scale our capacity to predict longer term outcomes of management on possum population recovery, dispersal and eradication of TB and spread of diseases (such as WPSV) and resistance, is limited.
|
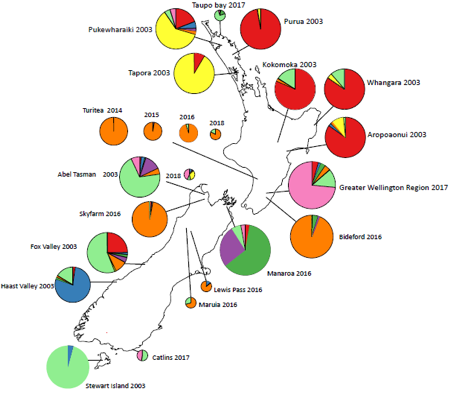
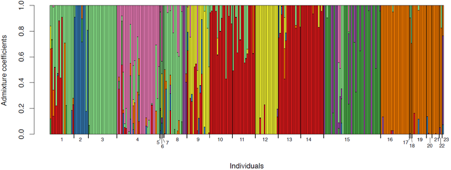
Bar plot from Structure analysis in R (K = 8). Each bar represents an individual, each colour a genotypic cluster. The length of the colours (y-axis) in each bar (admixture coefficient) is the assignment probability that the individual’s genotype belongs to those clusters. The numbers on the x-axis represent each population. The above NZ map shows sample sites with each pie chart representing the proportion of genotypes as shown in the bar plot
|
| |
|
Presentations:
Pattabiraman N, Morgan-Richards M & Trewick SA (2018) Landscape genetics of brushtail possums (Trichosurus vulpecula) in New Zealand for conservation management. New Zealand Molecular Ecology Conference.
Pattabiraman N, Morgan-Richards M & Trewick SA (2018) Landscape genetics of brushtail possums (Trichosurus vulpecula) in New Zealand for conservation management. Society for Conservation Biology.
Pattabiraman N, Morgan-Richards M & Trewick SA (2018) Landscape genetics of brushtail possums (Trichosurus vulpecula) in New Zealand for conservation management. School of Agriculture and Environment Symposium.
Qualifications:
B.E Biotechnology 2016, VTU Bangalore, India.
MSc Conservation Biology 2019, Massey University, New Zealand.
|
|