PhaDNA lab
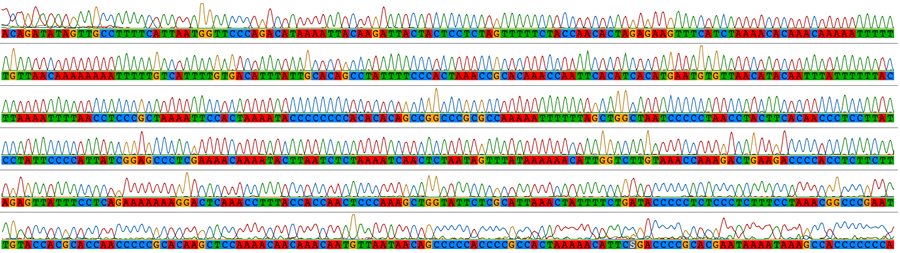
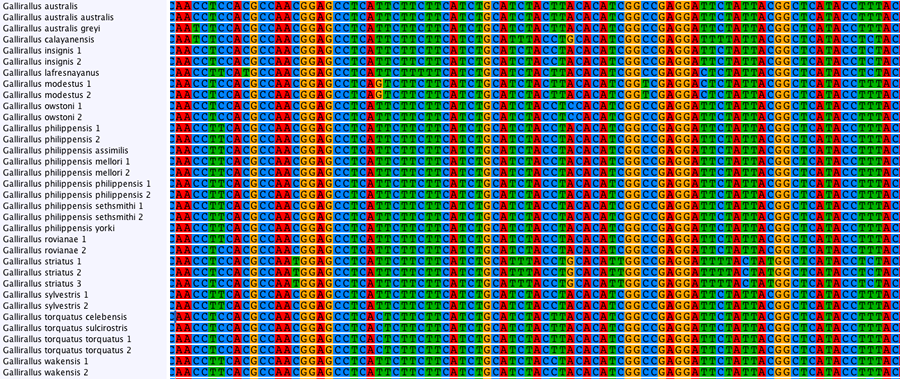
Traditional sequencing allows the targeted amplification of particular genes of interest. DNA is amplified by polymerase chain reaction (PCR) using specific primers and sequenced using Sanger sequencing. The resulting electropherograms (below) are checked for errors then aligned (bottom) for phylogenetic analysis.
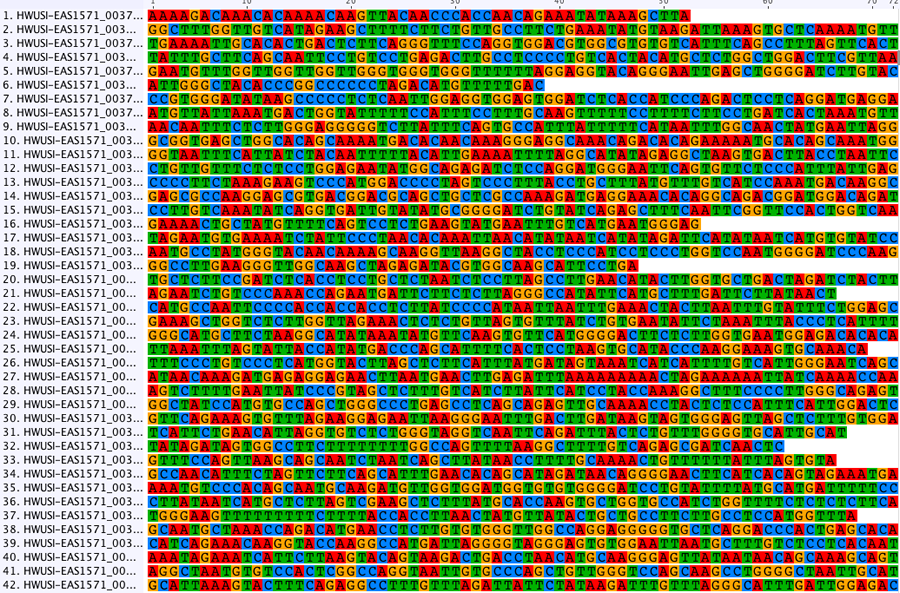
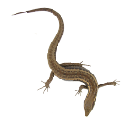
PCR is powerful because it can make use of small amounts of starting DNA which means that even old specimens and some fossils can provide a source DNA. For this we use a dedicated ancient DNA lab (see aDNA). PCR also allows data to be collected from rare or small species and as little tissue as a single hair or feather tip can be sufficient. This is especially valuable for studies of conservation genetics. PCR allows particular genes or parts of a genome to be targeted so the resulting data can be readily aligned for comparison. PCR is also used to target microsatellites (short repeat sequences) for genotyping. In our lab, PCR has been used to generate data in a wide range of population genetics, phylogeographic and phylogenetic studies of birds, lizards, insects and other animals. Below is an alignment of mitochondrial sequence from species of rail.
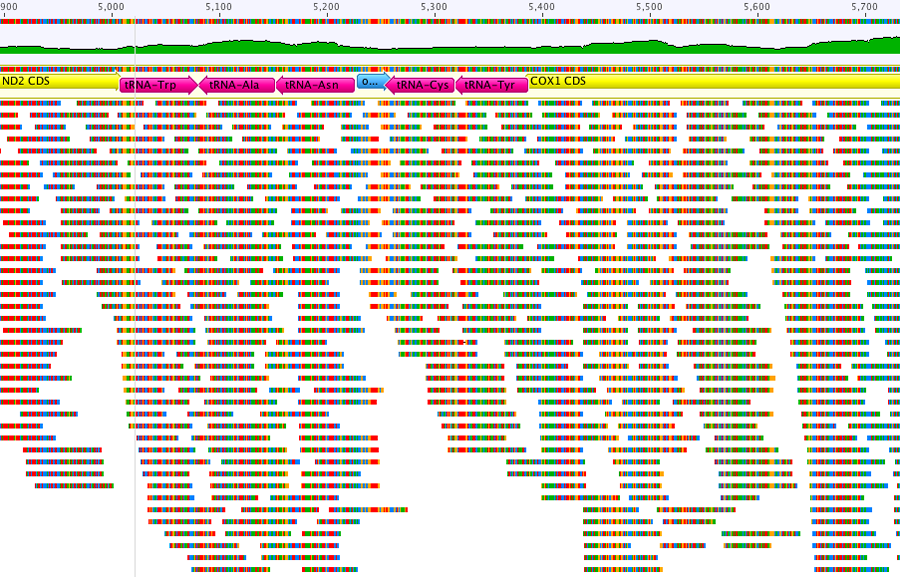
Next Gen sequencing has revolutionized the way we collect data for molecular ecology and evolution. Millions of short sequence reads are produced in parallel, and must be assembled into longer contigs using mapping or de-novo sequence assembly methods. Among the applications of these approaches employed in our lab are the generation of entire mitochondrial DNA genome sequences of birds (e.g. studies of speciation in rails, Rallidae), sequencing of nuclear genes of insects using copyDNA from messengerRNA extracted from target species, and compilation of large scale population genetic arrays using tools such as restriction site associated markers.
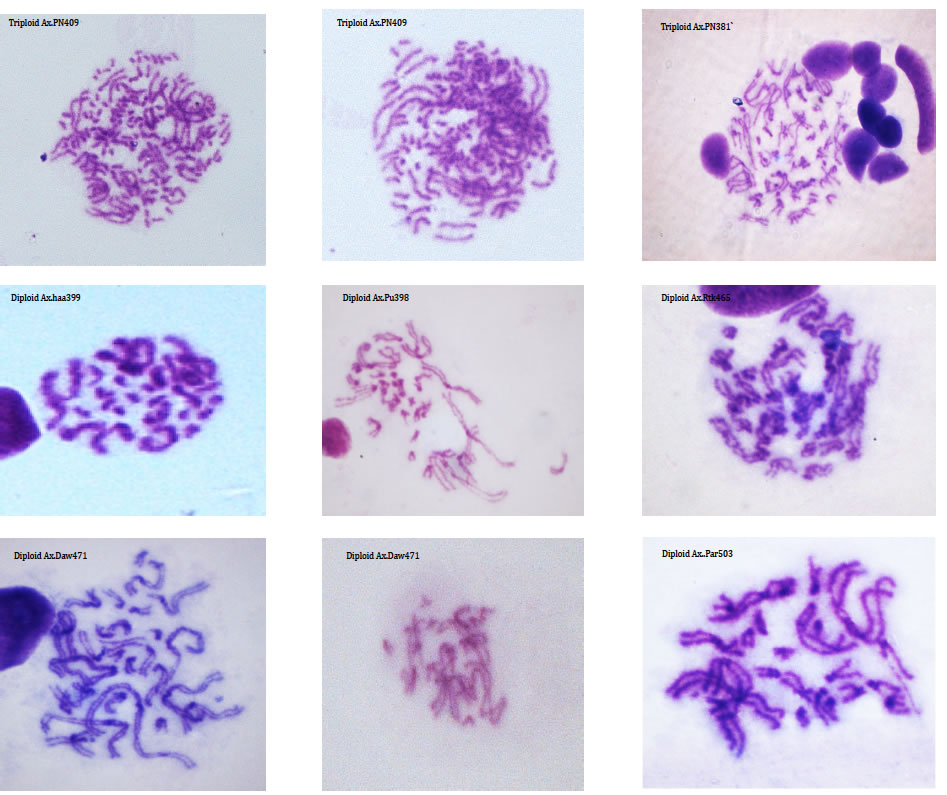
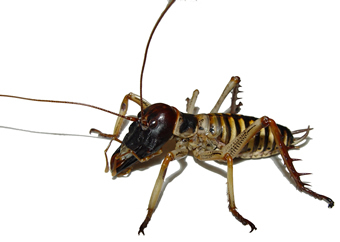
Karyotypes, Cytology & Flow-cytometry DNA is organised into chromosomes that, during cell division, can be seen and studied using light microscopes. By studying the number of chromosomes within individuals, populations and species we can document genetic variation. The relative size and centromere position of chromosomes is used to describe the complete set of chromosomes (the karyotype) of a taxon. Although many species have a characteristic genome size and karyotypes, there is a good deal of variation within some lineages. For example the Auckland tree weta, Hemideina thoracica, has at least eight different chromosome races, each with its own distinctive karyotype (Morgan-Richards 1997). Intraspecific karyotype variation is not concordant with allozyme variation in the Auckland tree weta of New Zealand. We use plain staining of chromosomes from insects (using Geimsa) to document chromosome rearrangements and study hybrid zones (Morgan-Richards et al. 2001) and understand changes in ploidy (Myers et al. 2012). Ploidy level variation can also be investigated by measuring the amount of DNA per cell. Estimates of genome size using flow-cytometry are important for understanding chromosome rearrangements (Morgan-Richards 2005) and can aid identification of hybrids (Morgan-Richards et al. 2004). Increasingly, genome size estimates are important during high-throughput DNA sequencing projects.
Data Files from various studies can be downloaded from here:
|
||||||||||||||||||||||||||||
 |
Phoenix Group Evolutionary Ecology & Genetics |
 |